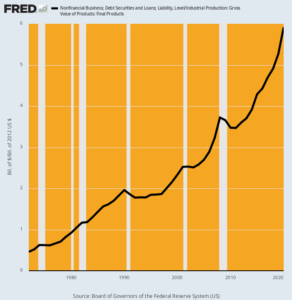
The massive leveraging of US nonfinancial businesses over the last several decades is utterly incompatible with the stock market cap rising from 62% to 204% of GDP.
The US business economy is now carrying 13X more leverage than it did 50 years ago.
Nonfinancial Business Debt as % of Gross Production, 1972–2020

Here is what has actually happened to business balance sheets:
- Back in 1972, total business debt outstanding of $634 billion amounted to just 46% of the gross value of US industrial production, which was $1.38 trillion.
- By 2007, business debt had soared to $10.1 trillion and stood at 321% of the gross industrial production of $3.15 trillion.
- By 2020 the debt figure had risen to $17.7 trillion even as the value of industrial production had remained pinned to the flat line. That is to say, at the end of last year’s Fed-fueled borrowing spree in the US business economy, the leverage ratio clocked in at an off-the-charts 592%.
With this high leverage, growth and profits-generation will become steadily weaker over time. This means that the stock market capitalization rate of the national income should be falling, not heading skyward as described above.
Indeed, since March 2009 equity investors have come to realize that any correction would lead to a bounce and a new upward run. At the beginning it took a long time before positive trading emotions and Pavlovian rewards emerged, but as the bull run accelerated, the rewards came faster and faster.
Until very recently.


This link may be removed, please download and/or print asap.
https://articles.mercola.com/sites/articles/archive/2021/11/20/a-complete-overhaul-of-the-us-financial-system.aspx?ui=e9b6776fdc3d43df3c41921268fcf4239653ca7ecec44d49642663374a814e69&sd=20210518&cid_source=dnl&cid_medium=email&cid_content=art2ReadMore&cid=20211120&mid=DM1047279&rid=1327966945