
Of course, as we first said last week, and as BBG echoes today, “just how many deposits fled small banks for the systemically-important competitors will go some way into shaping the market’s view of how enduring or systemic the pressure on small financial institutions will be moving forward.”
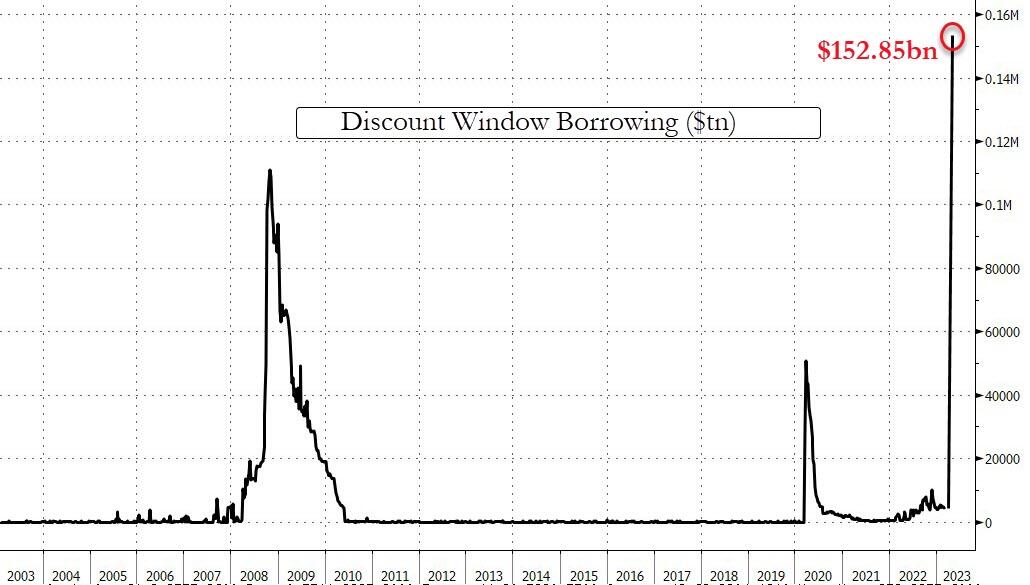
Meanwhile, the Fed’s more timely H.4 release from last week confirmed that GSIBs saw a significant inflow of funds given the large increase in bank reserves in Fed regions hosting the headquarters of the money-center banks, offset by substantial outflows at small banks which piled into the Discount Window to fund liquidity shortfalls; in fact, as we observed last week, the Discount Window saw a record one-week surge of $152.8 BN…
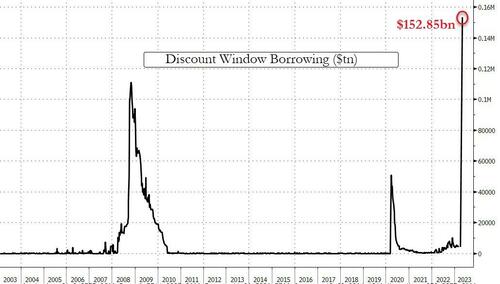
… which when coupled with “Other credit extensions” – which include various FDIC loans – saw the Fed’s balance sheet soar by $300 billion, the biggest jump since April 2020 and erasing half of the Fed’s QT balance sheet shrinkage.
~~~~~~~~~~~~~~~~
If only people understood the magnitude of the above chart and its consequences, we could have had a better future. The $152 billion is more than all of the aid from the US and NATO to Ukraine to fund Biden’s proxy war over the course of a year (not a week).
Imagine if people could actually comprehend the level of debt that our “leaders” have accumulated to seize power and enslave us. Consider that the total operating budget of the US in 1969 was $186.2 billion. And this was during the Vietnam War. Maybe the cost of money is not relevant at this point. Does it make a difference if the US debt is quantified but people do not comprehend the depth of their slavery?
David DeGerolamo
