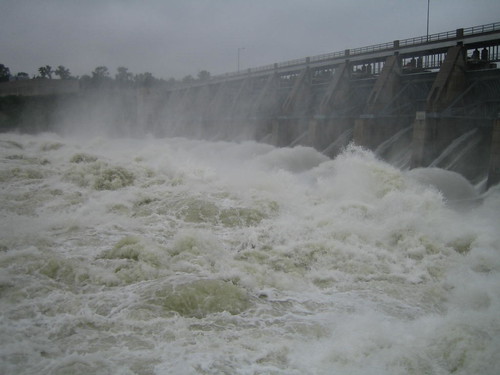
 The US Army Corps of Engineers provides detailed information concerning dams in the Missouri River basin. The graphics presented in this article are all documented back to their sources. The consequences of the Fort Peck dam in Montana failing as outlined in the article Missouri River Flooding – Nasa Satellite Images would be the worst catastrophe in our nation’s history.
The current lake levels at Fort Peck Lake are shown below. http://fortpeck.uslakes.info/LevelCal.asp
The following chart shows the June 24th elevation at 2251.58 ft. The design elevation for this dam is 2250 feet as shown in the next chart.
http://www.nwd-mr.usace.army.mil/rcc/reports/showrep.cgi?3MRDTAP7
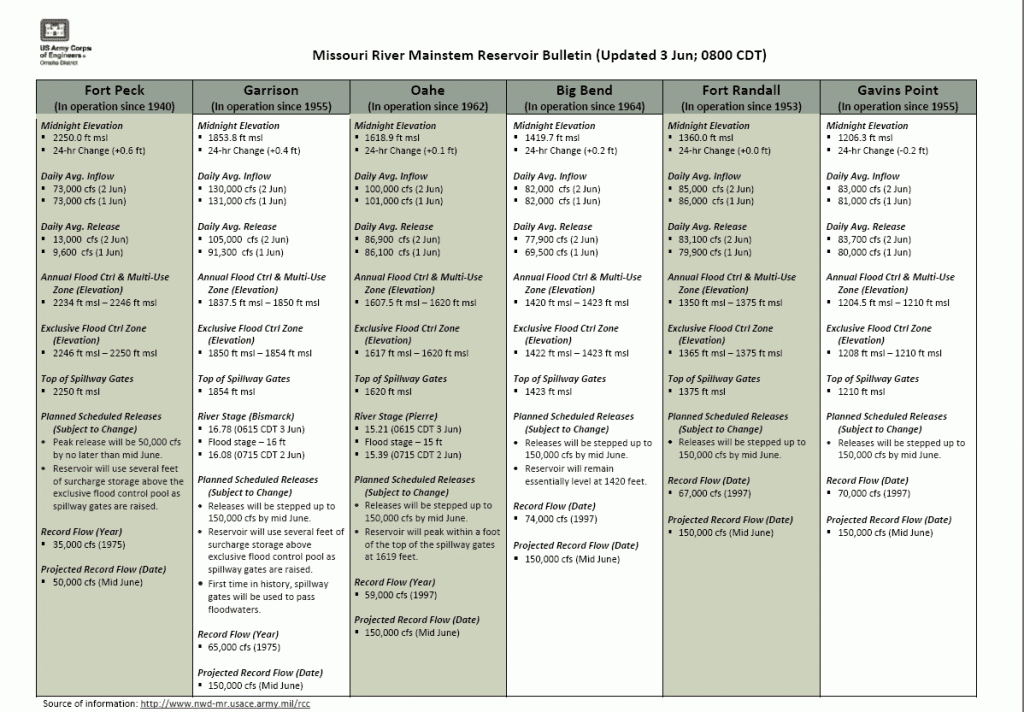
The following bulletin was last updated on June 3 but shows the design specifications for the six dams on the Missouri River that will impact the flooding throughout the midwest.
The mountain snowpack information shown below along with higher than normal rainfall totals are the two factors contributing to the flooding. The snowpack was a known issue and should have been accounted for previously by the COE. No one is discussing the ramifications of the Missouri River flooding through mid-August on the Mississippi River.
http://www.nwd-mr.usace.army.mil/rcc/reports/snow.pdf
Visit this site for current conditions from the Army Corps of Engineers:
http://www.nwd-mr.usace.army.mil/rcc/
This situation will be unfolding for at least two more months. Even though most media outlets are ignoring this flood, there is no reason why Congress is not holding hearings on this issue.
David DeGerolamo


